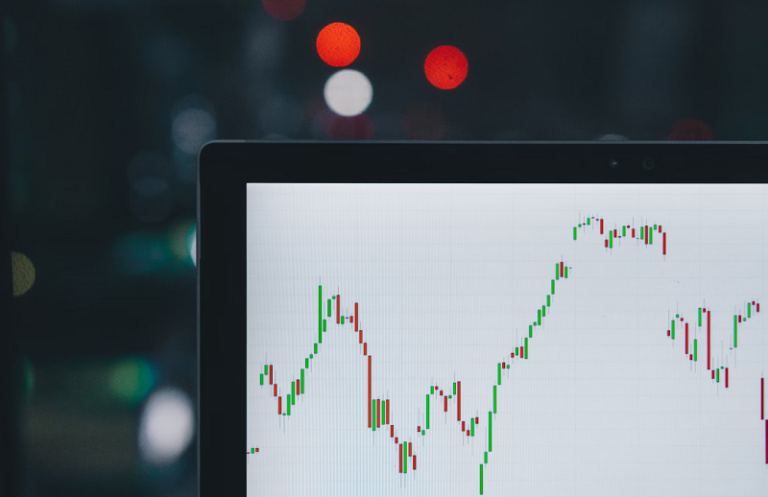
Candlestick patterns have long been a favorite tool for traders, providing valuable visual cues to interpret market sentiment and predict price movements across a variety of assets. While many beginners may think these patterns are only useful for stock trading, the truth is they can be applied to a wide range of assets in your portfolio, including commodities, cryptocurrencies, and forex.
Stocks have traditionally been the classic playground for candlestick patterns, with patterns like the “Doji,” “Hammer,” or “Engulfing” helping investors track potential reversals or continuations in price trends. For example, a “Shooting Star” pattern appearing after a prolonged uptrend in a stock like Tesla could signal a potential price drop, while a “Morning Star” pattern after a downtrend might indicate a shift towards optimism.
In the forex market, currency pairs like EUR/USD, GBP/JPY, and USD/CHF often exhibit clear candlestick patterns that can guide traders through volatile price movements. A “Bearish Engulfing” pattern in the EUR/USD pair could signal a weakening euro against the dollar, while a “Bullish Harami” pattern might suggest a potential buying opportunity.
Cryptocurrencies have also seen the integration of candlestick patterns to navigate the volatile market. Patterns like the “Hammer” or “Dark Cloud Cover” can provide insights into potential price reversals or continuations in assets like Bitcoin or Ethereum. The 24/7 nature of crypto markets allows traders to spot patterns at any time, offering continuous opportunities for informed trading decisions.
Commodities, such as precious metals, agricultural products, and energy resources, can also benefit from candlestick patterns to track price movements. For example, a “Bullish Engulfing” pattern in gold might indicate a potential price increase, while a “Doji” in the oil market could suggest indecision among traders and a possible reversal.
Traders looking to analyze broader market trends can use candlestick patterns on indices like the S&P 500, NASDAQ, or Dow Jones Industrial Average. Patterns like the “Three White Soldiers” or “Gravestone Doji” can provide insights into market sentiment and potential market movements, allowing traders to capitalize on broader market trends.
Overall, candlestick patterns are incredibly versatile and can be applied to a wide range of assets, offering valuable insights into price movements and market sentiment. Whether you’re a seasoned trader or just starting out, incorporating candlestick patterns into your trading strategy can enhance your decision-making and help you navigate the complexities of the financial markets with confidence.

